Google Chrome DevTools
Sebastien Caietta
Andre Wyrwa
@ THE ICONIC
Overview
- Mobile Devices
- Enhance Productivity
- Use the Console
Overview
- Inspect Elements
- SASS Life-editing
- Debug JavaScript
Overview
- Analyse Network Traffic
- Analyse Page Speed
- Profile JavaScript
- Debug Memory Leaks
Overview
- Inspect Resources
- Run automated audits
- Extending DevTools
- Hack it & Contribute
Mobile Devices
because mobile first...Emulate Mobile Devices
-
Have fun with the breakpoints
Resolution, pixel ratio, orientation
-
Think about another behaviour
Touch emulation, network throttling
-
Note worthy features
Accelerometer, location emulator, custom devices
Remote debug devices
Too Easy with Android
- Enable USB debugging.
- chrome://inspect
- Open Dev Tools.
- ???
- Profit.
App debugging
Android 4.4+ and a WebView configured for debugging.
iOS users, rest assured, you can do it with Safari. ![]()
Enhance Productivity
-
Get used to keyboard shortcuts...
...and use them!
-
Explore settings
Disable cache, add folder to workspace, show colors as authored, enable user agent styles...
Use the keyboard
-
⌘⌥I - toggle dev tools
J to focus directly on console
- ⎋ - toggle Console drawer
- use ⌘+0/-/+ to zoom
- Enable ⌘ + 1-9 shortcut to switch panels
- ⌘O - open any loaded file anytime
-
⌘⇧F - search for text in loaded files anytime
C to open in inspection element mode
- Full list in Settings -> Shortcuts
The Console
Console Overview
-
Get the max out of the panel
Preserve logs, filters, frame selector
-
Don't forget the settings
Log XHR requests, show timestamps...
console.log
and some others you might now know-
Supports string substitution
Also %c for css styles and %o / %O for Node/javascript representationconsole.log("%s has %d points", "Sam", 100); -
Use the siblings for easy filtering:
warn(), error(), info(), debug()
-
Advanced usages
Grouping with
,group('logging')
,console.log('Getting data from DB', logging)
Get a call stack of your execution point withgroupEnd()
Log timing withconsole.trace()
,time('logging')
Show on the timeline panel when your script is executed withtimeEnd('logging')console.timeStamp('my-script')
Devtools Command Line
- $(...) - return first element
- $$(...) - return all elements
- $x(...) - resolve xpath
- $_ - return last result
-
Inspect your data
table([{ firstName: "John", lastName: "Smith" },{firstName:"Jane",lastName:"Doe"}]);
,keys(object)values(object)
Element references
- use $0 to access the currently selected element
- use $1-$4 to access the previous four
-
Combine with other inspection commands
,inspect($0)
,dir($0)copy($0)
Monitor events and functions
(un)monitor(TI.app.init)debug(TI.app.init)(un)monitorEvents(window, ["resize", “scroll"])getEventListeners($0)And much more
-
clear() the command line window
Or ⌘K
- Commandline API documentation
Inspect Elements
Style Panel
-
Never type again!
Color picker, easing function editor, control animation speed
-
Be lazy, or accurate, or both...
Use arrow-keys and modifiers to increment/decrement numeric properties ⌥ ±0.1
⇧ ±10
⇧⇞ ±100 -
Use pseudo-classes
:hover, do not underestimate :focus and :active for touch devices
-
It still doesn't work!!!
Give a look to the computed styles! Or add your style to the stylesheet you want
Other features
- Use your mouse
Rearrange, add pseudo-class, copy css or xpath, scroll into view, break on ...
-
Event Listeners and Properties Panel
Inspect all listeners registered, includes listeners reached through bubbling Check the javascript representation of elements
Extensions
- Angular Scope Inspector
- jQuery Audit
Sources
- ⌘O or ⌘P to open any file from anywhere
- ⌘⌥F from anywhere to find stuff in any files
- ⌘⇧O to find methods/selectors within that file
- use pretty-print {} button to reformat compacted files
Life-editing SASS files in 7 steps
- Compass 1.0 + SASS 3.4
- Add
in config.rb{sourcemap => true} - Remove hashes in Assetic
- Enable css source maps in DevTools
- Add folder to workspace
- Map files to network
- Compass watch
Content Scripts / Snippets
- Save javascript snippets
- With internal history
Debug JavaScript
-
Break the points
debugger; XHR, DOM, Conditional
-
Analyse your code
Scope variables, spys, evaluate
-
Go in depth
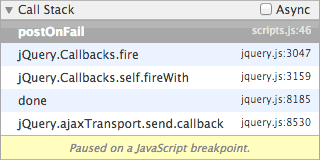
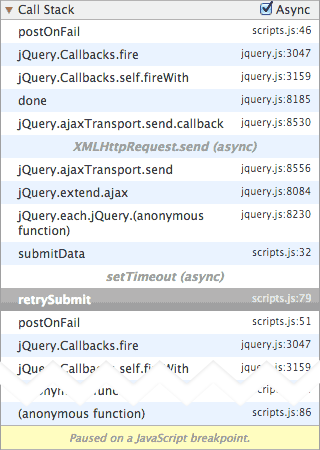
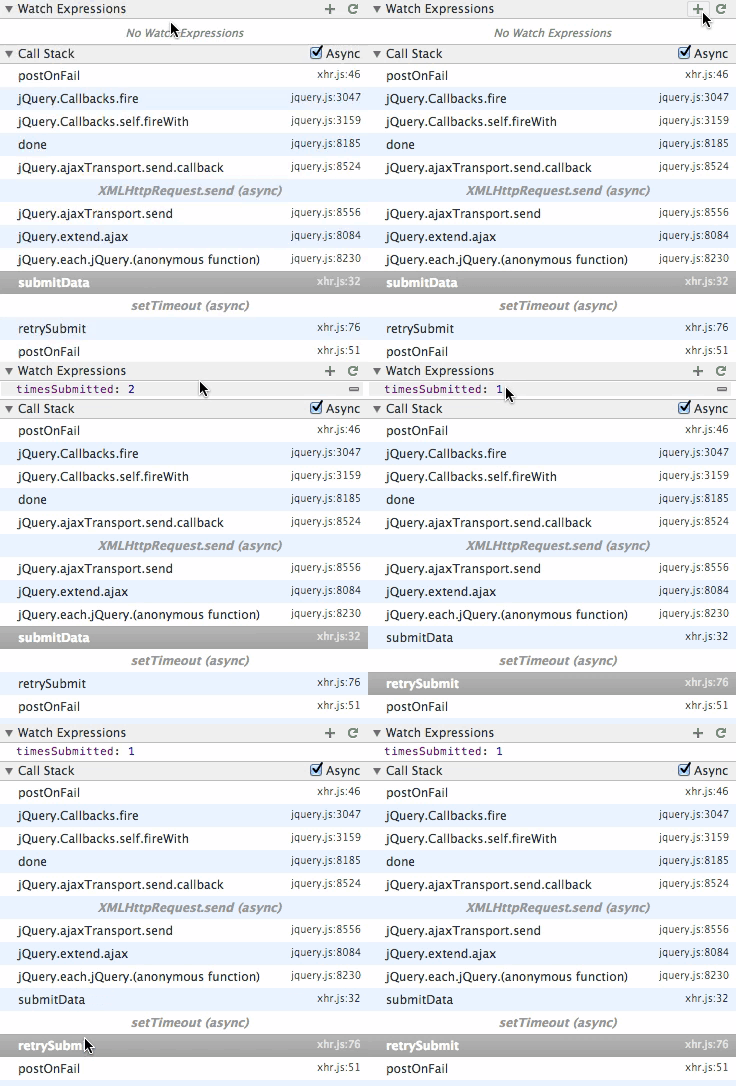
Call stack, async debugging
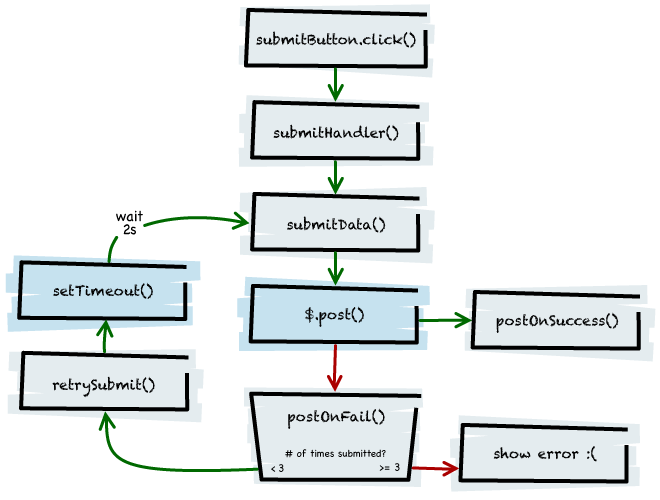
Async Debugging


Analyse Network traffic
-
check cacheing strategyCache-Control, ETag, Last-Modified
-
analyse connection re-useConnection Id, Keep-Alive
-
verify transmission standard (HTTP/Chunked/SPDY)Content-Encoding, Content-Length, Protocol
-
measure impactTime, Size
-
find the causeInitiator
Waterfall view
- look for stalled requests
- find dns lookups and initial connections
- watch for overly long TTFB and download times
Filter
- hide data urls
-
filter by...
- status-code
- set-cookie-name/value
- has-response-header
and more
- copy headers
- copy as curl
- replay XHR
- save as HAR
Analyse Page Speed
- analyse execution order
- layout thrashing
- optimise animations
Timeline
great tool for performance and execution analysis
-
3 async layers
- Network
- Javascript
- Layout, Paint & Compositing
- look for gaps and blockers
- add markers via console.timeStamp()
Events View
shows in-depth view of what happens when
- activate 'Causes'
- activate 'Paint' to see snapshots of painted areas
- grouped events illustrate causalities
- grey cpu load bars at top
- forced layouts marked by warning triangles
- pay attention to Aggregated Time, Total Time & Self Time
Flame Chart View
visual execution overview
- use WASD keys to navigate
- forced layouts marked by red corners
- look for horizontally large strips
Frames View
shows animation frames
- use for Paint/Compositing optimisation
- look for large frames and events that exceed frames
Memory View
spot memory leaks
- use trashcan icon to force GC cycles
- look for increasing memory base line after GC cycles
- look for increase in listeners, DOM nodes and JS objects
Profile JavaScript
-
create from JS
console.profile(); ... console.profileEnd(); -
visualize JS execution by time
Chart
-
find most time consuming methods
Heavy (Bottom up)
-
drill down through execution tree
Tree (Bottom up)
Debug Memory Leaks
- identify in Timeline
- debug in Heap Profiler
Identify memory leaks in Timeline
- activate Memory view
- execute suspicious action(s)
- execute steps to rewind to original state
- hit trashcan button to force GC cycle
- repeat at least 5 times
Steady growth of lows after GC cycles indicate memory leaks.
Create Heap Profile
- open incognito Window
- select Record Heap Allocations and hit start
- execute actions and repeat at least 5 times
- and/or force GC cycles in between
- hit stop
Analyse Heap Profile
- blue lines are leftover objects
- use timeline to narrow to a section
- use Summary or Containment view to analyse objects
- use Retainers view to trace open references
Inspect Resources
- loaded resources
- Cookies
- localStorage
- sessionStorage
- IndexedDb
- Application Cache
Run automated audits
- use Web Page Performance audits
Custom audits
- enable chrome://flags - Experimental Extension APIs
- follow the documentation
Extending DevTools
It's all HTML/JS/CSS - no magic!
- lots of good extensions available, e.g. Terminal, PHPConsole etc.
- extensive documentation available
Hack it & Contribute
It's all HTML/JS/CSS - no magic!
- grab a devtools-frontend.zip
- extract it to some dir
-
run chrome with
--debug-devtools-frontend=dir
Or read the Contribution Guide on how to contribute to upstream.
And much more...
- enable chrome://flags - Experimental Developer Tools Experiments
- install Chrome Canary for latest experimental features
- Cheatsheet
- Command line switches